Dashboard: Difference between revisions
No edit summary |
No edit summary |
||
| Line 1: | Line 1: | ||
PHENOM's Dashboard is the first screen users will see when they log in. The Dashboard communicates the latest general analytics regarding the core model | PHENOM's Dashboard is the first screen users will see when they log in. The Dashboard communicates the latest general analytics regarding the core model, recent changes to the model, and the most recent as well as archived Release Notes, containing a summary of the latest features added to PHENOM. The dashboard also provides a series of Quick Links - these are common actions intended to help the novice user find what they need easily. | ||
== Using the Dashboard == | == Using the Dashboard == | ||
| Line 10: | Line 10: | ||
On the left-hand side, you will see the navigation links. This is where you can choose between the major functions of PHENOM. | On the left-hand side, you will see the navigation links. This is where you can choose between the major functions of PHENOM. | ||
NOTE: This interface is expected to change | NOTE: This interface is expected to change. While it may look different and the currently listed commands may be allocated to another place on the website, the function remains the same. Use this area to switch between the main modes of operation of the site. | ||
[[File:Phenom dashboard 2.jpg|thumb|center]] | [[File:Phenom dashboard 2.jpg|thumb|center]] | ||
Across the top of the dashboard, you see | Across the top of the dashboard, you see the project overview. This is a live count of the number of entities, attributes, and views currently managed in your branch. The shapes, sizes and proportions of the regions in the overview can provide a high-level idea of model quality and how the model is currently used. | ||
[[File:Phenom dashboard 3.jpg|thumb|center]] | [[File:Phenom dashboard 3.jpg|thumb|center]] | ||
| Line 22: | Line 22: | ||
[[File:Phenom dashboard 5.jpg|thumb|center]] | [[File:Phenom dashboard 5.jpg|thumb|center]] | ||
Finally, you see the notification area | Finally, you see the notification area typically used to announce the features added in the latest release. When you log in, you can go here to find out what has changed since the last update of the software. | ||
[[File:Phenom dashboard 4.jpg|thumb|center]] | [[File:Phenom dashboard 4.jpg|thumb|center]] | ||
Revision as of 08:38, 14 March 2024
PHENOM's Dashboard is the first screen users will see when they log in. The Dashboard communicates the latest general analytics regarding the core model, recent changes to the model, and the most recent as well as archived Release Notes, containing a summary of the latest features added to PHENOM. The dashboard also provides a series of Quick Links - these are common actions intended to help the novice user find what they need easily.
Using the Dashboard
When you first log into PHENOM, you will see your personal dashboard. This section will show you the key elements of the dashboard.
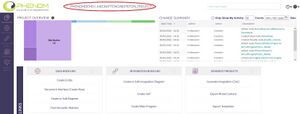
Across the very top of your dashboard, you find your login name as well as the name of your current branch. Read more about Branches. Since PHENOM allows you to change branches and work in other models, this is a helpful tool so you can be sure that you are editing the branch of the model you expect.

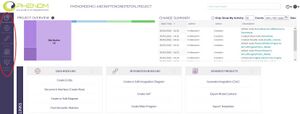
On the left-hand side, you will see the navigation links. This is where you can choose between the major functions of PHENOM.
NOTE: This interface is expected to change. While it may look different and the currently listed commands may be allocated to another place on the website, the function remains the same. Use this area to switch between the main modes of operation of the site.

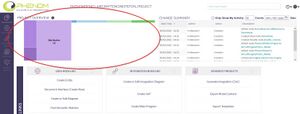
Across the top of the dashboard, you see the project overview. This is a live count of the number of entities, attributes, and views currently managed in your branch. The shapes, sizes and proportions of the regions in the overview can provide a high-level idea of model quality and how the model is currently used.

The next section is a series of Quick Links. These are common actions that are commonly performed in PHENOM and is intended to help a novice user quickly navigate to the correct function.

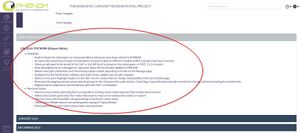
Finally, you see the notification area typically used to announce the features added in the latest release. When you log in, you can go here to find out what has changed since the last update of the software.
