Meridian Map: Difference between revisions
| Line 21: | Line 21: | ||
[[File:Phenom-data model-meridian map attribute name.png|1000px|border]] | [[File:Phenom-data model-meridian map attribute name.png|1000px|border]] | ||
Finally, the heart of the Meridian Map shows the connectivity between two (or more) attributes. When multiple views are added to the diagram, their semantics are compared and matched. An arc is drawn for each of the attributes with matching semantics and the semantic description (the concept to which that attribute corresponds) is displayed when hovering it. When a semantic connections band is selected, more detailed information about that match is rendered in a small table below the Meridian Map. | Finally, the heart of the Meridian Map shows the connectivity between two (or more) attributes. When multiple views are added to the diagram, their semantics are compared and matched. An arc is drawn for each of the attributes with matching semantics and the semantic description (the concept to which that attribute corresponds) is displayed when hovering it. | ||
A semantic arc can be blue or red: | |||
* Blue indicates Semantic Match | |||
* Red indicates Semantic Match with same Measurement | |||
Blue will match Latitude <-> Longitude (because, conceptually, they are both position). However, Red will further distinguish based on their measurements (i.e., it uses semantics + measurements) | |||
If the user checks the "Logical Matches Only" box located in the top right corner, only red arcs will be displayed. | |||
When a semantic connections band is selected, more detailed information about that match is rendered in a small table below the Meridian Map. | |||
[[File:Phenom-data model-meridian map semantic match selected.png|1000px|border]] | [[File:Phenom-data model-meridian map semantic match selected.png|1000px|border]] | ||
| Line 28: | Line 36: | ||
[[File:Phenom-data model-meridian map attribute selected.png|1000px|border]] | [[File:Phenom-data model-meridian map attribute selected.png|1000px|border]] | ||
Revision as of 12:36, 13 October 2022
Using the Meridian Map
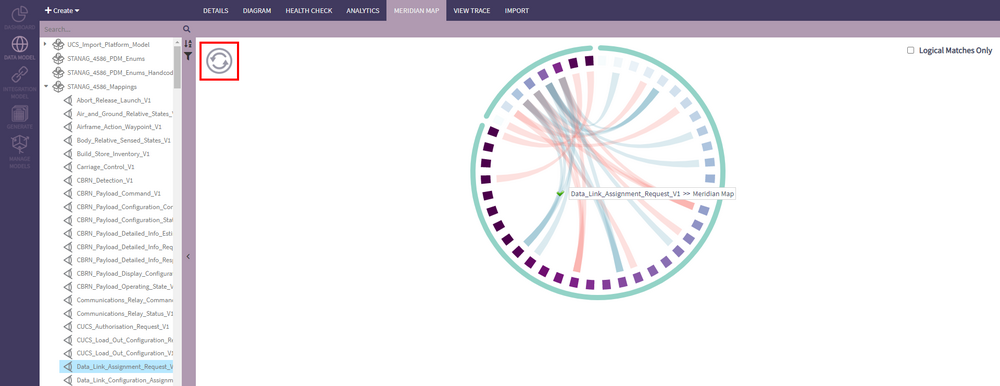
To access the Meridian Map, go to the Data Model mode and click the Meridian Map tab.
After selecting the views the user is interesting in, to add them to the map, the user can:
- Drag them over the map and drop them when a green checkmark appears. The views can be added either one at a time or multiple at one.
- Click the Refresh button. This will replace any existing views previously added to the map with the newly selected ones.
Anatomy of the Meridian Map
The Meridian Map contains three crucial pieces of information.
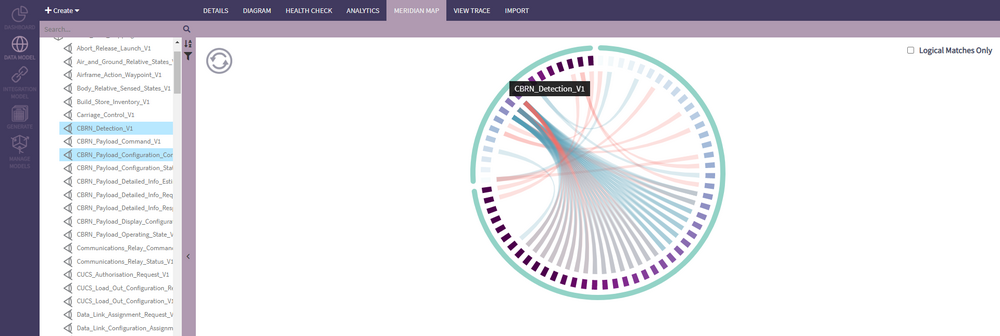
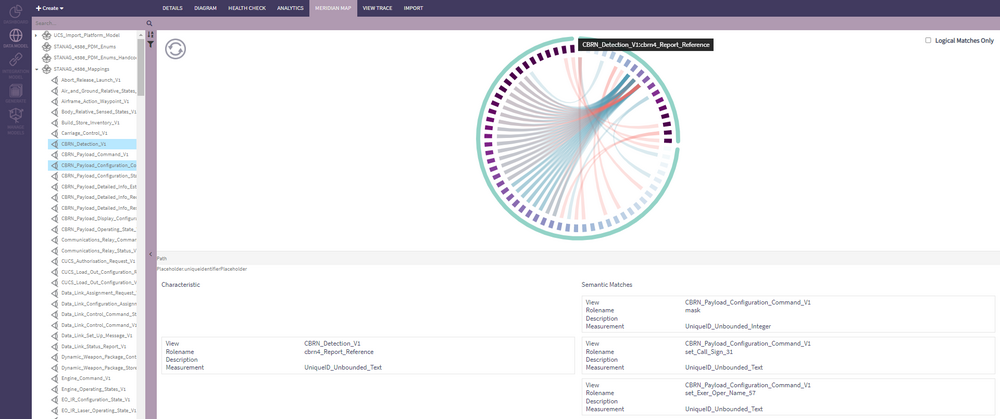
The teal line around the outside of the Meridian Map represents the View. In some cases, this may be considered a software interface or even a message. Mousing over the arc will display the name of the corresponding view.
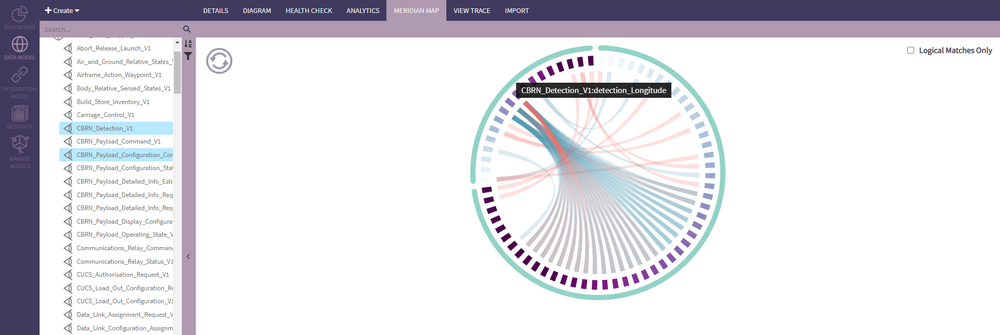
The smaller squares that line the inside of the Meridian Map represent the attributes of the views. Ultimately, the attributes are the most important elements to map to other views. Views, in their entirety, are not expected to map. Mousing over each square will display the name of the view and its attribute.
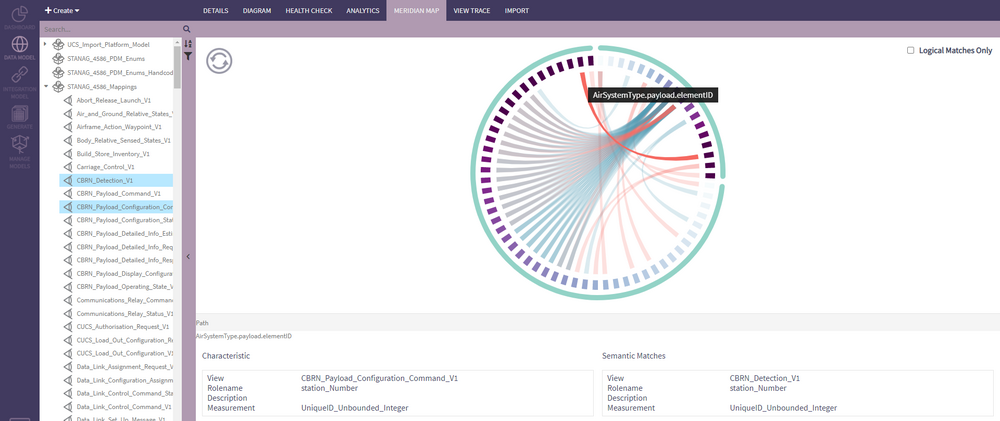
Finally, the heart of the Meridian Map shows the connectivity between two (or more) attributes. When multiple views are added to the diagram, their semantics are compared and matched. An arc is drawn for each of the attributes with matching semantics and the semantic description (the concept to which that attribute corresponds) is displayed when hovering it.
A semantic arc can be blue or red:
- Blue indicates Semantic Match
- Red indicates Semantic Match with same Measurement
Blue will match Latitude <-> Longitude (because, conceptually, they are both position). However, Red will further distinguish based on their measurements (i.e., it uses semantics + measurements) If the user checks the "Logical Matches Only" box located in the top right corner, only red arcs will be displayed.
When a semantic connections band is selected, more detailed information about that match is rendered in a small table below the Meridian Map.
When an attribute is selected, all of its semantic matches are rendered in the same table. If there is more than one match, all will be rendered in the right-hand column.

