View Trace: Difference between revisions
| Line 13: | Line 13: | ||
[[File:Phenom-data model-view trace all matches traced.png|1200px|border]] | [[File:Phenom-data model-view trace all matches traced.png|1200px|border]] | ||
Click the "Clear Nubs" button to clean up items that don't have a match on the other side. | Click the "Clear Nubs" button to clean up items that don't have a match on the other side. | ||
Revision as of 13:53, 13 October 2022
Using the View Trace
To access the Meridian Map, go to the Data Model mode and click the View Trace tab.
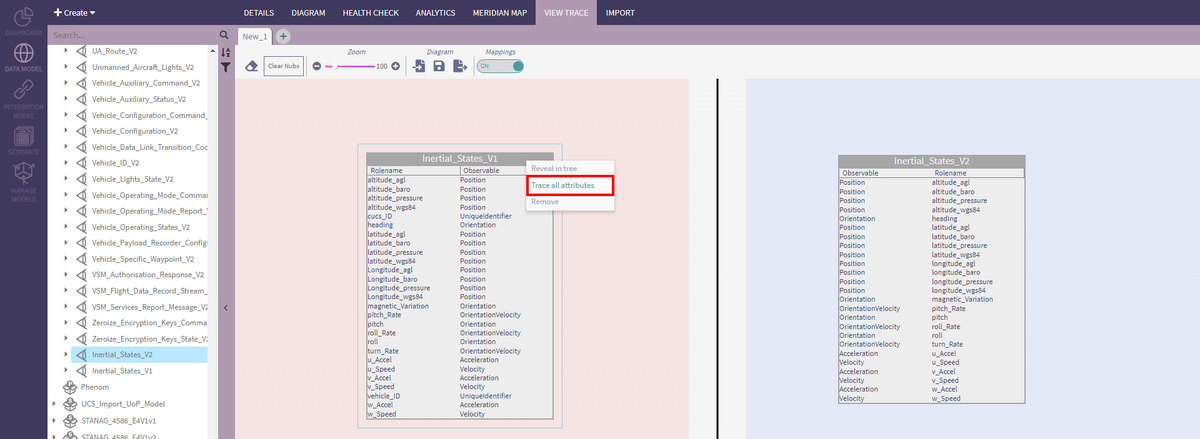
Drag and drop 2 views into the red and blue areas. They must be on opposite 'teams' to enable the mapping between them.
Right-click on a view and select "Trace all attributes" to display all the semantic matches between the views' attributes. Note that the colors don't have any meaning, they just allow better differentiation between the clusters of matchings.
Click the "Clear Nubs" button to clean up items that don't have a match on the other side.
ADD IMAGE
The View Trace works like the main Diagram tool. As such, the user can
- Create multiple View Trace diagrams by clicking the + icons next to the last diagram tab
- Save the View Trace
- Load a save View Trace
- Export the View Trace as a png image
Semantic Matches
As described in the Semantic Matches page, to display the Semantic Matches for a specific View Characteristic, click on it.
Preferred Mappings
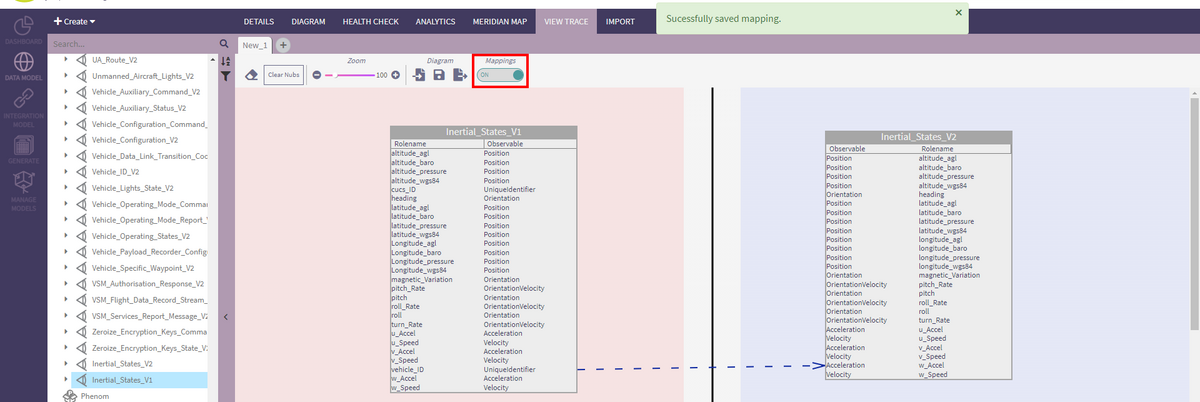
To capture a custom mapping, drag the mouse from the left-side attribute's type to the right-side attribute that should match. A dotted-line arrow will be displayed indicating the custom mapping.
In the top menu, the "Mappings" toggle allows the user to display or hide the custom mappings.
Right-clicking on a preferred mapping the user can:
- Remove the mapping: this will remove the mapping from the diagram but not delete it. To make it reappear, click twice the "Mappings" toggle
- Delete the mapping: this will permanently delete the mapping.


