Diagram
Diagrams are a useful tools for visualizing and exploring your project. They demonstrate visual connectivity and relationships including associations, compositions and semantic paths. For convenience, they can be saved and exported for future re-use.
Diagram interface overview
Interface overview
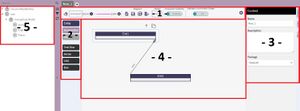
The Diagram interface is composed of 5 parts:
- Main top menu for the most used features of diagrams
- Stencils for creating new diagram content
- Details and Usages panels on the right
- The center canvas to visualize and arrange diagram content
- The NavTree on the far left
General menu actions

The first set of actions in the menu allows:
- Clear Diagram: Removes all objects from the canvas
- Auto layout: Rearranges all objects on the canvas
- Zoom: Custom zoom levels for the canvas area
Interface modes

A diagram can be used in one of two modes (1) Modeling (2) Projection:
Modeling mode

This is the standard entity diagramming mode that allows for the editing of entities and associations. This includes the creation of composition and association relationships.
In modeling mode, the projection connectors are hidden.
Projection mode

This mode is specifically designed for the creation and editing of Views. This includes the creation, editing and displaying of the semantic projection paths making up that View.
In projection mode, the modeling connectors are hidden.
Managing elements on a Diagram
Adding elements to the diagram
Elements can be added to the diagram canvas from different locations:
- From the stencil panel: Dragging an object from the stencil panel will create new entities, associations, and views. These elements are not committed to any model, but can be found in the NavTree under the UncommittedEntities package.
- From the NavTree: Dragging an existing object from the Navtree will add those objects to the diagram canvas where they can be directly edited and saved within the diagram.

To create a composition, click and drag the icon to another object.

To create an association, click and drag the icon to another object.
Note: An Association must have at least 2 connections to be valid.
Interacting with elements on the diagram
Most components on the diagram have a right-click contextual menu allowing the user to interact with them.
Below is a table detailing how mouse clicks interact with the elements on the diagram.
| Menu Item | Action |
|---|---|
| Edit | User can add/edit/hide/remove the node's attributes |
| Remove | Remove's the node from the diagram. The removed node will continue to persist in the model. |
| Reveal in tree | Finds the node in the Nav Tree. |
| Show all attributes | To reduce on-screen clutter, the user can choose to hide specific attributes. "Show all attributes" will reveal all hidden attributes. |
| Hide types | To reduce on-screen clutter, the user can choose to the attributes' type. |
| Show usage | This will open the Usage side panel and display the node's referencers and referencees. |
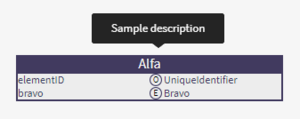
When hovering over an entity, a tooltip displays its description.
When an entity or an association is selected, the right-side panel can display its details and usages:
- Details: Displays editable Name and Description fields for the entity.
- Usage: Displays usages of and relationships to that object throughout the rest of the model including Compositions, Associations, Specializations and Views.
Deleting and removing elements
The option to "Remove" exists for all diagram objects. This means that they are removed from the diagram but they still exist in the model or in the UncommittedEntities list.
An option located in the Gear menu on the far right of the menu bar allows the user to switch off the Delete/Remove confirmation messages for convenience.
Diagram management

There are 5 actions that can be performed on a diagram:
- Load: Allows the loading of a saved diagram and also the ability to delete saved diagrams.
- Save: Saves the current diagram. Everything that is displayed on the diagram (committed entities, uncommitted entities, connections, drawings...) will be saved in the diagram.
- Save As: Saves the current diagram as a new file.
- Export: Exports the diagram as a PNG image
- Commit: Commits the changes to the model and auto saves the diagram.
Note: if a diagram is not saved, then all changes made to it will be lost when the page is refreshed
Load Diagram

In the NavTree, double click the diagram node to load the diagram.
Committed and uncommitted entities
Uncommitted entities
Uncommitted entities are created by dragging an Entity, Association or View block from the stencil panel. Once on the diagram canvas, they can also be found in the NavTree under the UncommittedEntities package.
Note: If uncommitted entity is not saved in a diagram or committed, when the diagram page is refreshed, they are lost.

An uncommitted entity can be reused in all the diagrams that the user has open, but in order to be used within a View path, they must be committed first.
Commit entities
When an entity is created or updated from the diagram, the changes are not stored in any model until the user commits them.
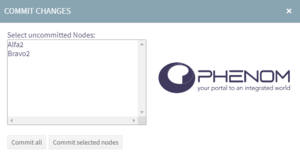
When the user clicks the "Commit" button, a dialog appears listing all the entities that have been created or updated. The user can chose to commit all or some of them to a specific model.
Note: If a diagram was saved with uncommitted entities, when they are committed, the diagram is re-saved to account for the change and keep the data synchronized.
Building view paths
To build, a new path for a view:
- Add a new field to a view. The rolename can be added later and the measurement will be added automatically when the path is built.
- Select the 1st hop in the path which will be either an entity or a path. The available elements are highlighted in green
Steps to create a path
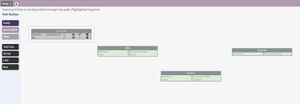
1. Select the Projected Characteristic. The selectable entities and associations are highlighted in green.

2. Select the next hop. The possible subsequent hops are highlighted in green. They are either an attribute within the current hop selected or within associations that contain the current hop
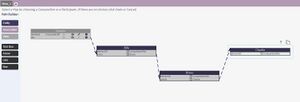
3. To complete the path, the last hop have to be typed as an Observable.

Paths can be shown/hidden using the eye icon. By using the show/hide eye icon repeatedly, the View paths will randomly change colors for convenience.